MT4 Candlestick Patterns Indicator allows you to visualize on the chart the most common candlestick patterns and trade in the direction that these patterns tend to predict. Some patterns identify the current trend reversal, some may confirm the trend continuation, while others may signal about support and resistance levels. The indicator identifies the following common known candlestick patterns:

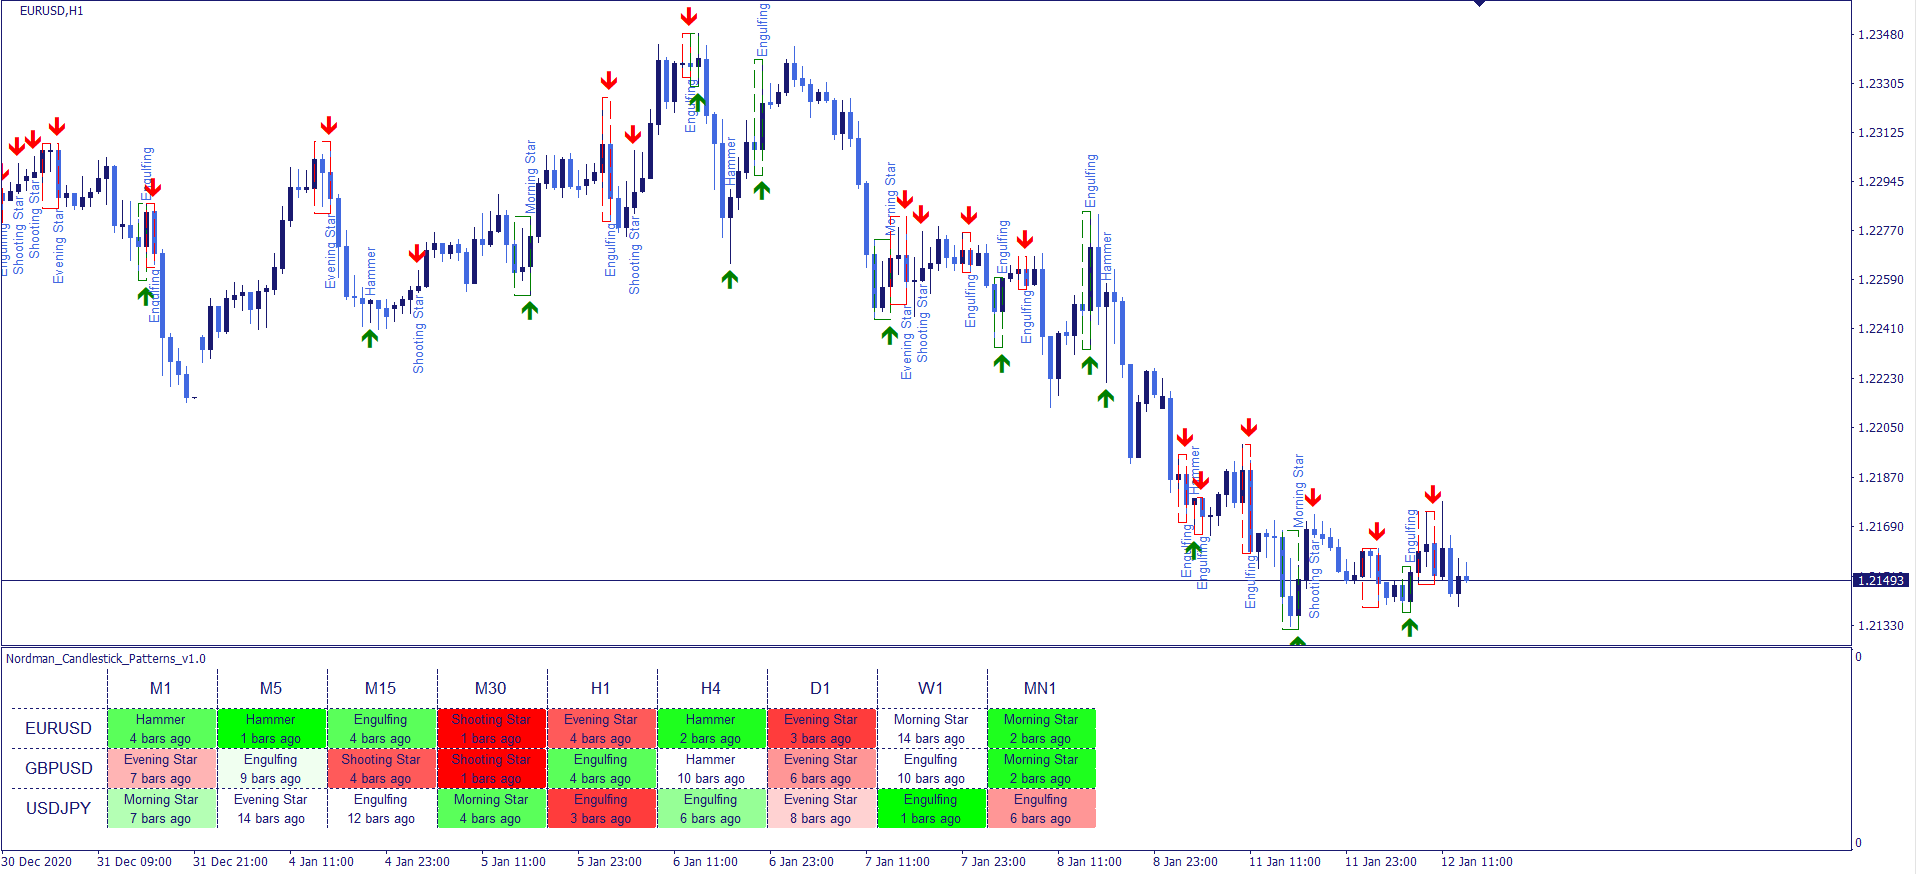
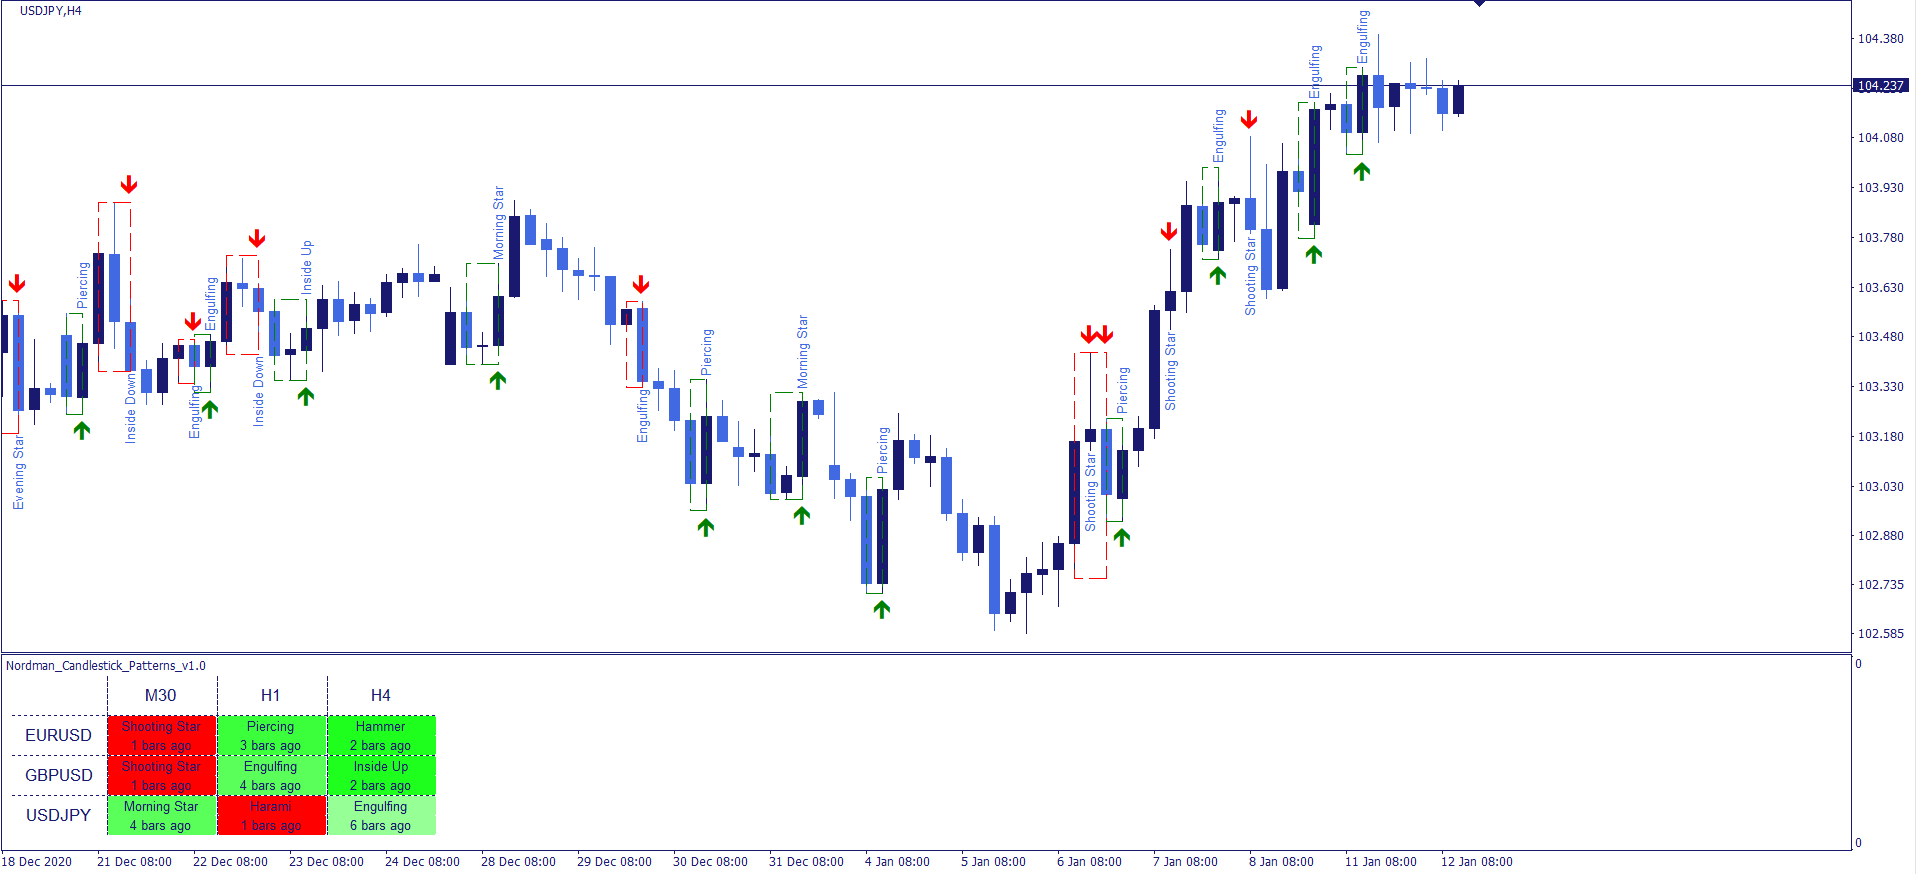
The indicator is designed in a form of a scanner that allows you to see the most recent pattern formed on a particular instrument/time frame chart. Such approach provides the ability to see the market in a glance identifying the most potential pairs and timeframes to trade.
Each pattern identified by the indicator is followed by a signal entry arrow that depicts the direction the pattern predicts. The candlestick patterns trading concept suggests to open a trade in the predicted direction aiming for trend reversal or continuation (depending on the current market situation). Please, do remeber to limit your risks within each trade.
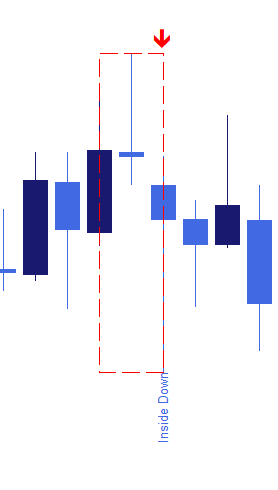
Each pattern consists of different amount of candles: there are simple 1-candle patterns, more complex 2- and 3-candle patterns, as well as even 5-candle patterns such as “Rising Three” or “Falling Three” patterns. The indicator highlights each pattern with a frame that is drawn around the group of candles that form the pattern. It also provides a direction of a potential trade that this particular pattern predicts. Next to the signal arrow and the frame, the name of the related pattern is printed.
The dashboard allows you to see the patterns formed in the market on different instruments and timeframes in a glance.
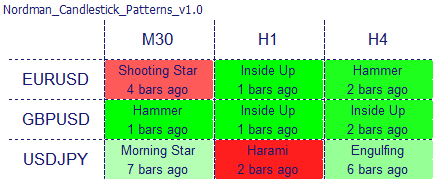
Each currency pair/timeframe cell contains the name of the most recent pattern identified on the related chart and the amount of bars ago this pattern has formed. The color of the box specifies whether the pattern was bullish or bearish – the more bars ago the pattern was identified, the more pale the color of the cell will be. This allows you to select the most relevant chart to trade.
Clicking on the related cell will change your chart to the instrument and timeframe of the clicked cell.
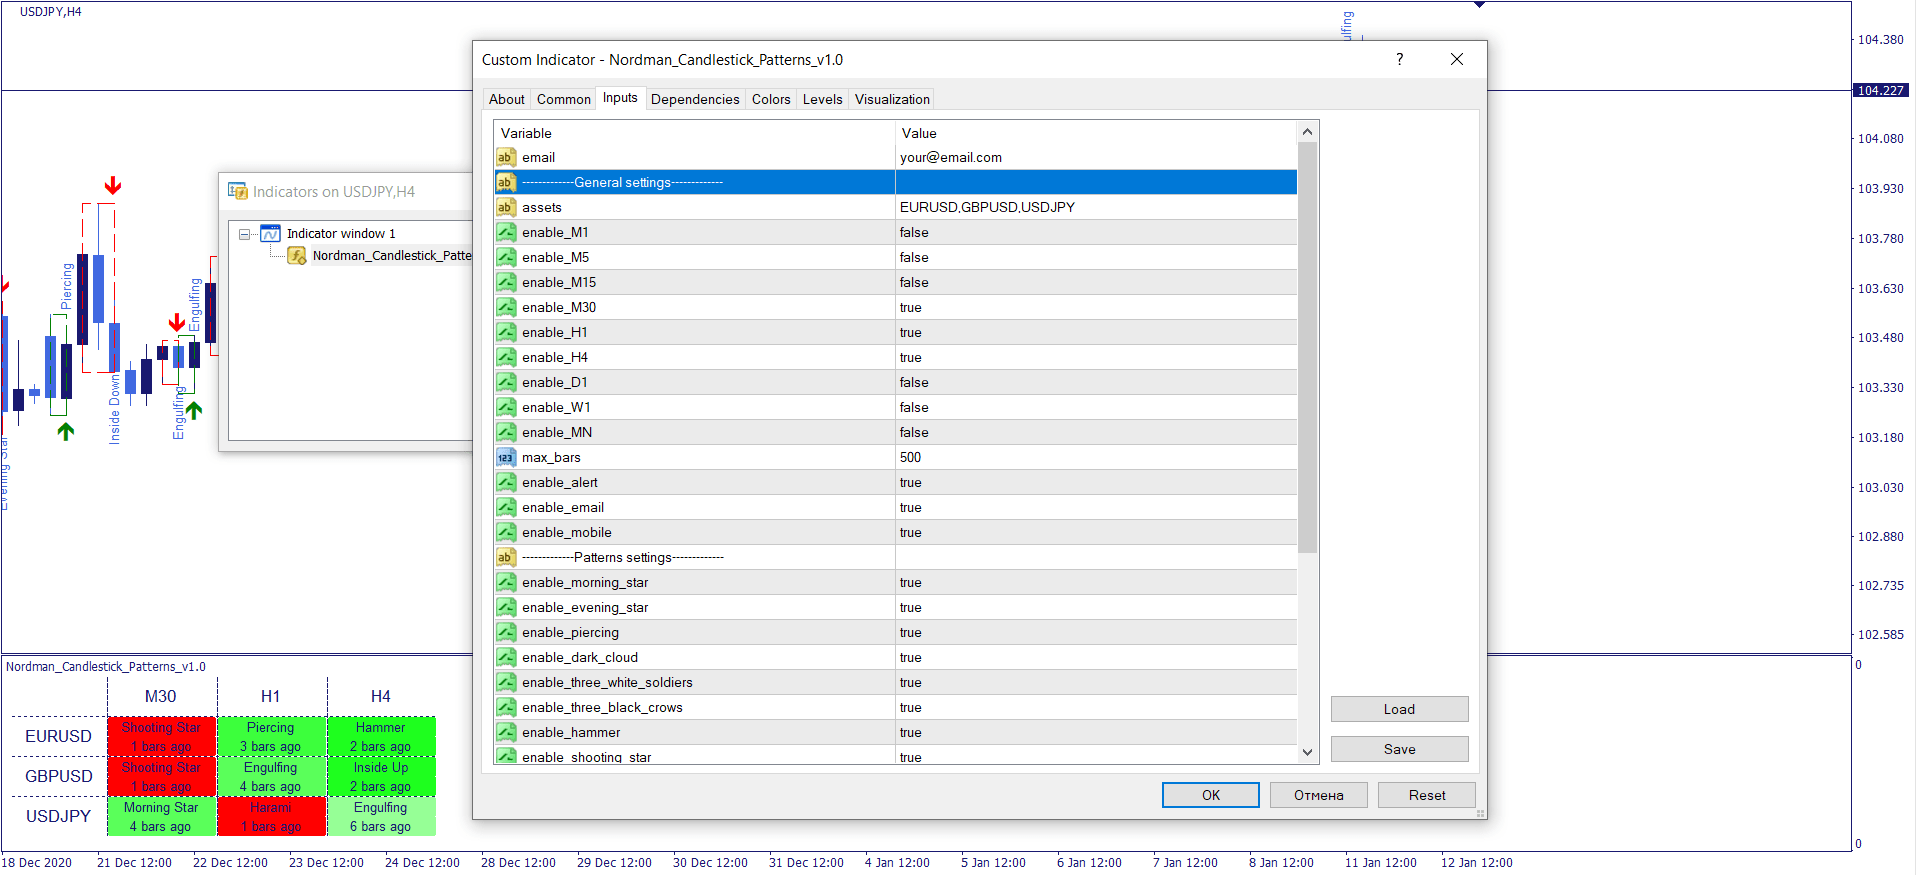
The indicator input parameters are pretty straightforward and self-explanatory. It allows you to select the currency pairs and timeframes that you want to monitor. Parameter “max_bars” limits the amount of calculations in order to speed up the indicator in case you do not need it to identify the patterns too far in the past.
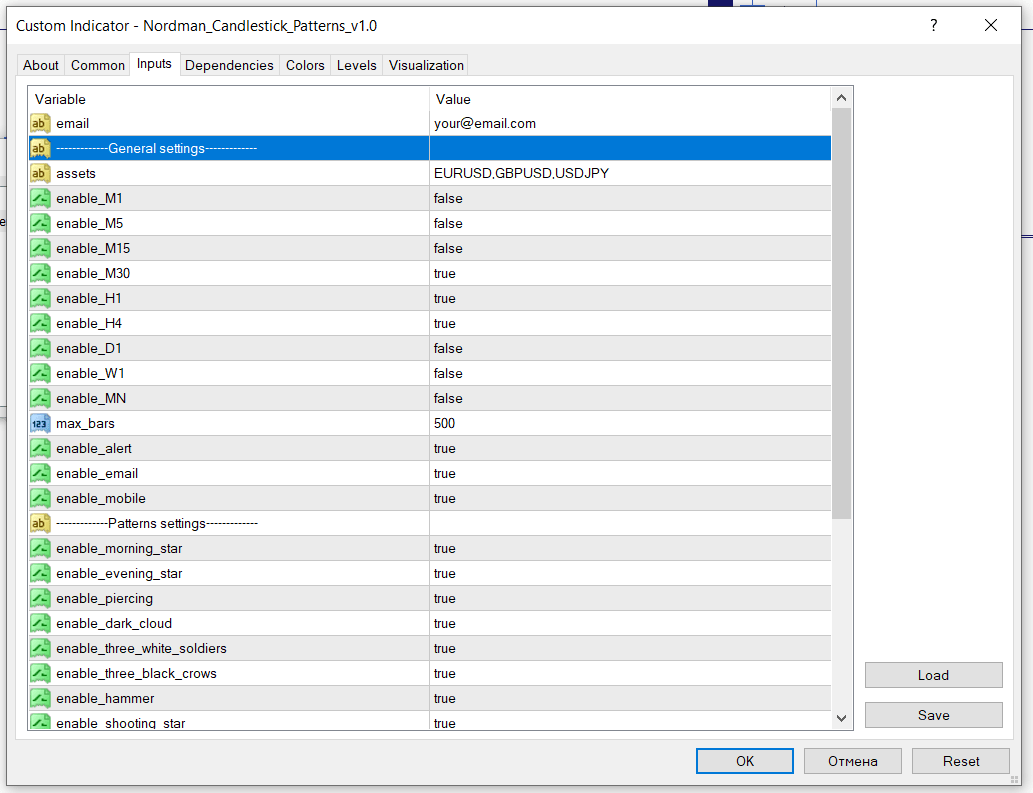
The indicator allows you to select which candlestick patterns to visualize on the chart in case there are some patterns that you do not want to follow or in case there are only specific patterns, in which you are interested.
We can also turn the indicator into an Expert Advisor (trading robot) with an extended set of custom functions (stop loss, take profit, trailing stop, risk management parameters, trading time limit, and others).
Request a free consultation from our team of professional programmers and find out the cost and timing of your project development.
Nordman Algorithms is not liable for any risk that you face using the software. Please, use the software on your own responsibility. The software is coded in accordance with a common known concept and Nordman Algorithms does not guarantee accuracy or trading performance of the software signals.
Futures, foreign currency and options trading contains substantial risk and is not for every investor. An investor could potentially lose all or more than the initial investment. Risk capital is money that can be lost without jeopardizing one’s financial security or lifestyle. Only risk capital should be used for trading and only those with sufficient risk capital should consider trading. Past performance is not necessarily indicative of future results. View Full Risk Disclosure.
CFTC Rules 4.41 – Hypothetical or Simulated performance results that have certain inherent limitations. Unlike the results shown in an actual performance record, these results do not represent actual trading. Also, because these trades have not actually been executed, these results may have under-or over-compensated for the impact, if any, of certain market factors, such as lack of liquidity. Simulated or hypothetical trading programs in general are also subject to the fact that they are designed with the benefit of hindsight. No representation is being made that any account will or is likely to achieve profits or losses similar to these being shown.